What is JMeter
- JMeter is an open source tool design by Apache to test the applications Performance and Robustness.
- JMeter can be used for web application testing and various server testing like Database using
JDBC, Mail, JMS, LDAP etc.
- It is developed in Java by Stefano Mazzocchi, initially developed to test Apache JServer (now Known as Apache Tomcat Server).
- JMeter is developed in such a way that we can write our own plugins to extend the capabilities of JMeter.
Why performance testing is necessary for application
- To identify the maximum operating capacity of a system.
- To identify any bottleneck which may occur in system operation and not in development.
- To determine the speed or performance of application or system on heavy load.
- To test robustness, availability and reliability under extreme condition.
Requirement
- JVM 1.5 or later
JMeter
You can download latest JMeter from
https://jmeter.apache.org/download_jmeter.cgi
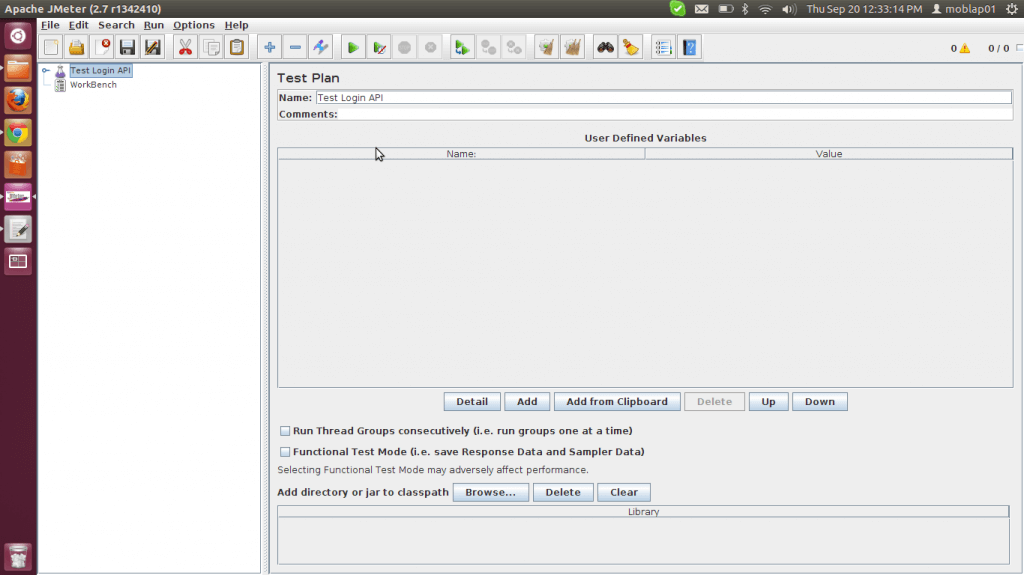
Extract the zip and start the jmeter, it will look like this
You can rename the test plan name and set to your choice. Also we can add user defined variables to out test plan for further use.
Starting with simple Login API Test
I have started with simple API that is Login API where we need to provide user name and password in request body.
Thread Group
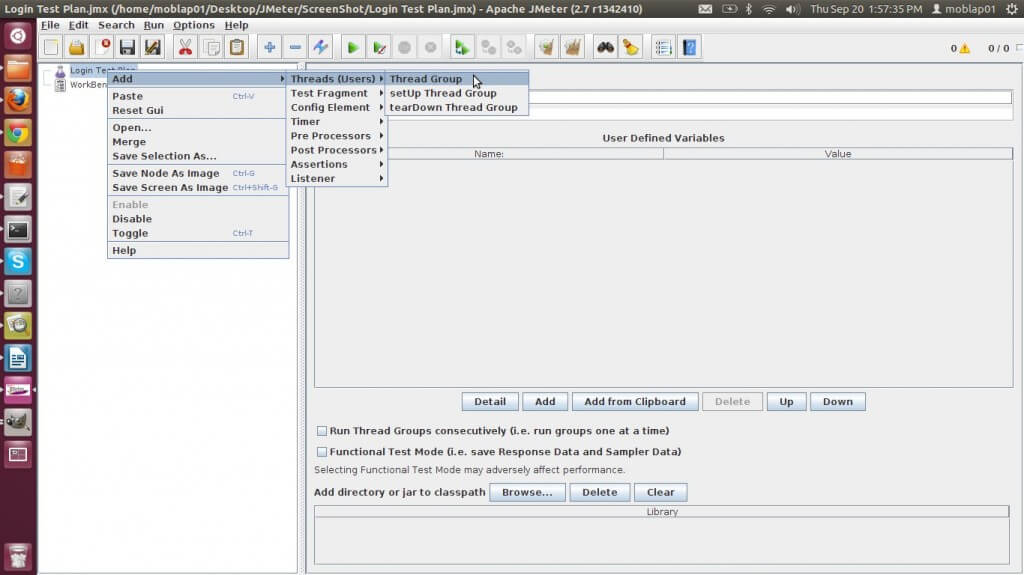
So First we need to add Thread Group to our test plan. Thread group means basically number of users we want to test with.
To add thread group right click on test plan go to Add –> Threads (Users) –> Thread Group, shown in below screenshot.
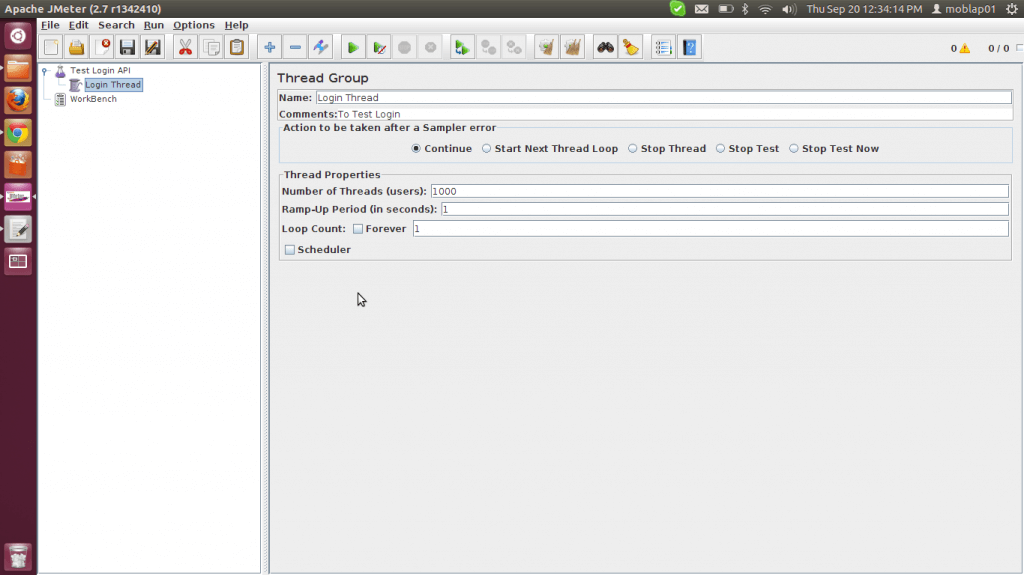
Thread Group window will look like this
Here you can name your thread group, Number of threads means no. of concurrent users. Secondly ramp-up period is the time interval in seconds to start the next thread after first thread (simply time intervals in threads), and finally loop count is the number of times this group thread will execute.
Http Request Sampler
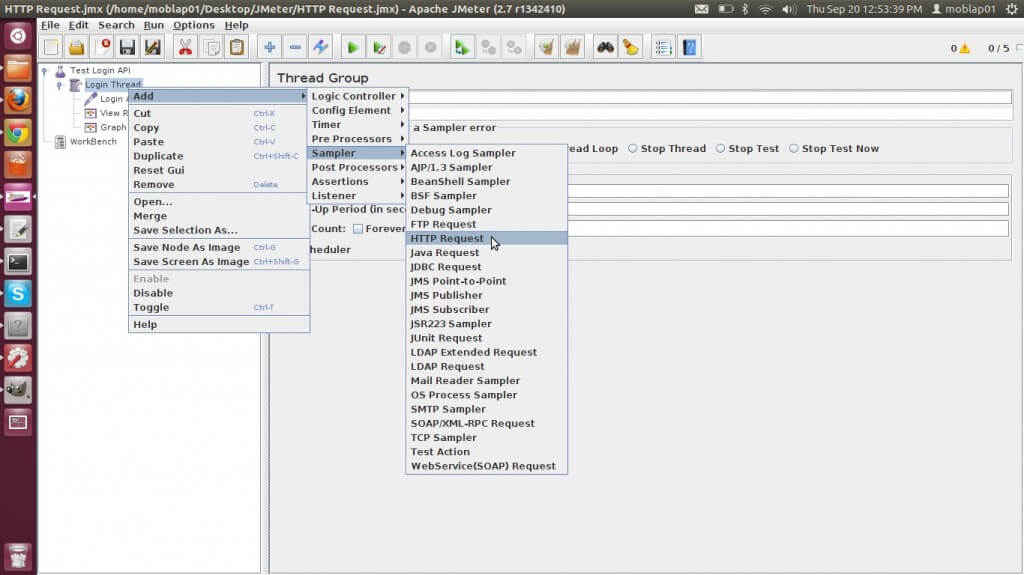
Now we need to add Http Request to out thread group. For that right click on Thread Group go to Add –> Sampler –> Http Request
Show in Below Screen shot.
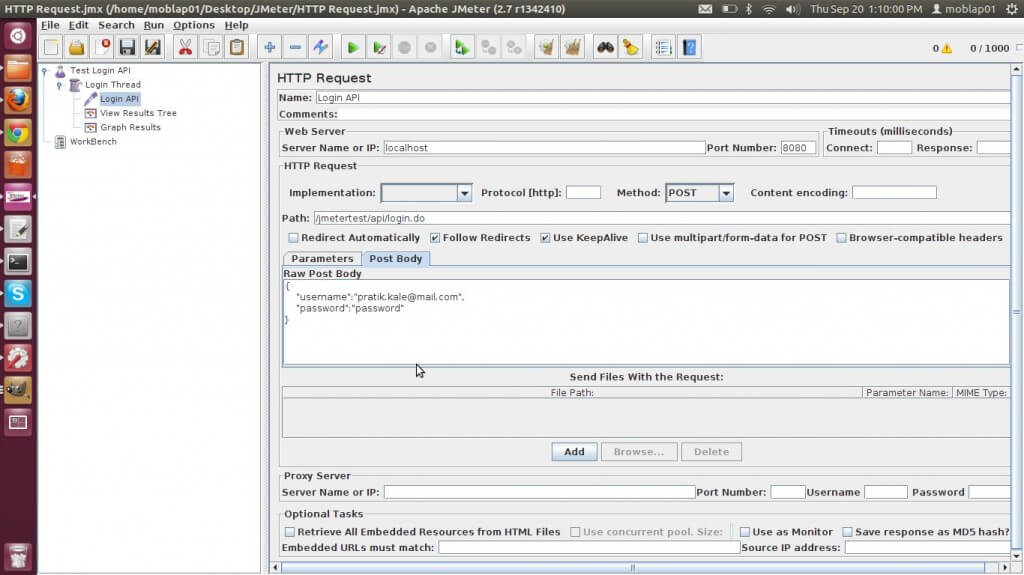
Http request sampler window will look like this
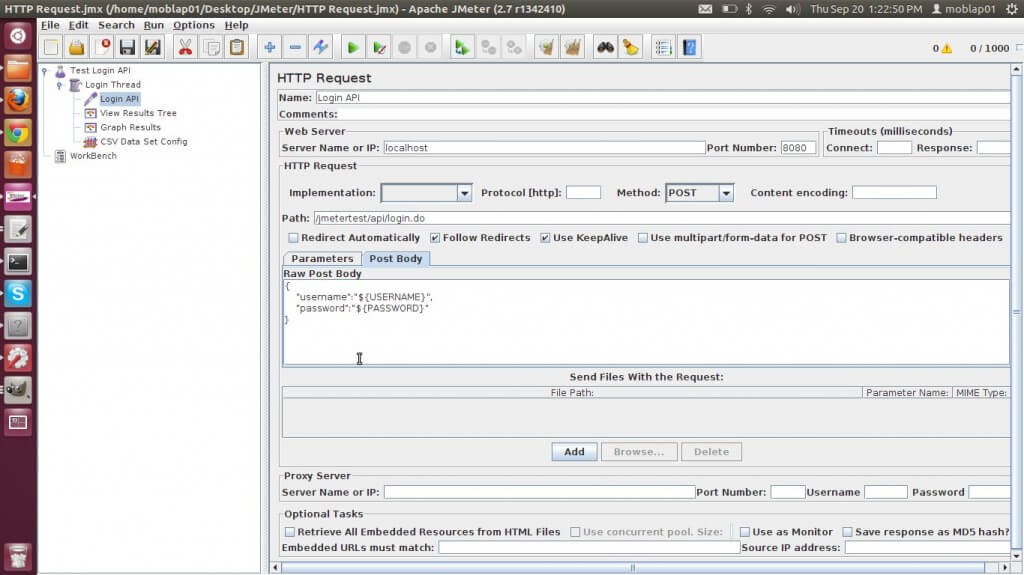
Here also you can name to your request, I have given “Login API”, then we have to provide our web server details. Server name Or IP of our server for my example it is localhost and server port no.
In Http Request Section you can specify protocol by default it is ‘http’ if you want to use ‘https’ then write there. Select your request type Post, Get, Put, etc. Then provide you API path for my example it is ‘/jmetertest/api/login.do’. If you want to add parameters for API then add it to ‘Parameter’ section and if your API has post body write in ‘Post Body’ section. Now you are done with your Http request.
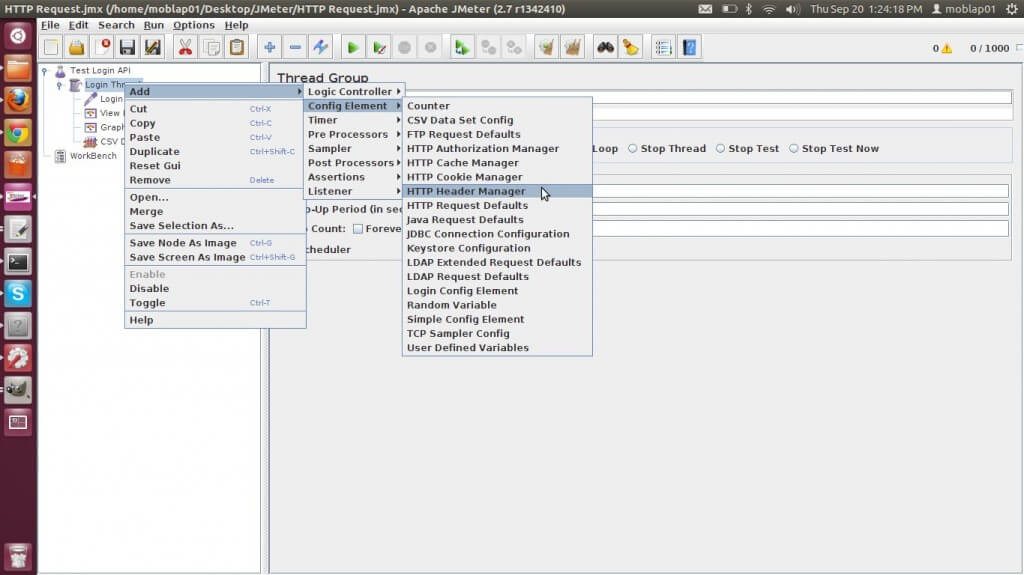
Request Headers
If your API need Headers then we can configure those headers in JMeter for that we need to add config element “Http Header Manager”. To add Http Header Manager config element to our Thread group, right click on thread group go to Add –> Config Element –> Http Header Manager. As shown in below screen shot.
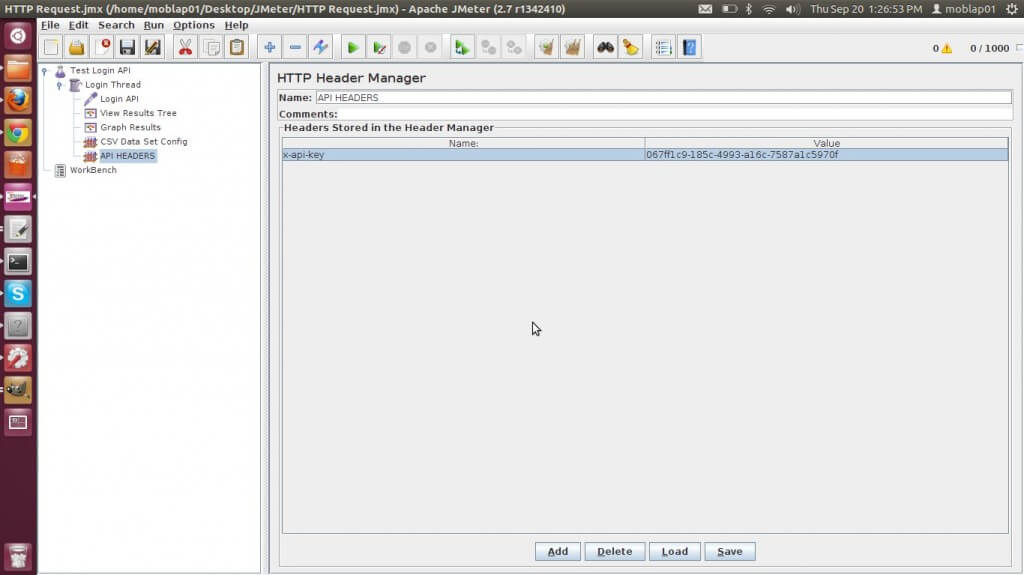
The Http Header Manager window will look like this
To add new header click on Add and provide header name and value. These headers will be added to your all http request during execution of threads.
CSV Config Element
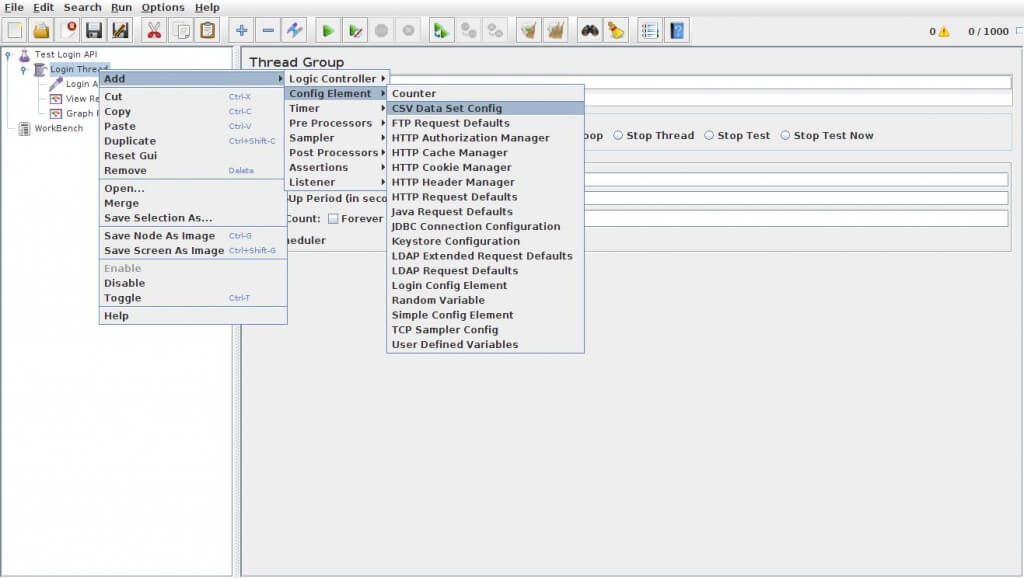
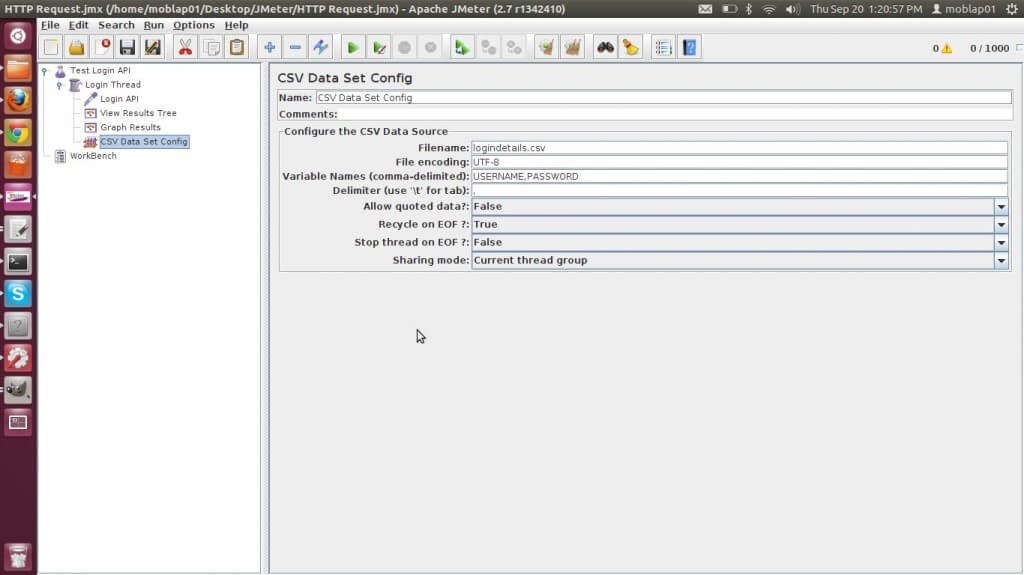
In API’s we need to give inputs, there is a way in JMeter to provide inputs from csv file. You can create csv file of your inputs and provide this file to JMeter. JMeter will read your csv file line by line and provide this data to your http request. So how to provide inputs from csv file, it’s pretty simple. Create your csv file, I have created logindetails.csv file (Attached below). Now right click on thread group and go to Add –> Config Element –> CSV data set Config, as shown below
Csv data set config window will look like this
So first name your csv config data set, then provide file name or path, but it is recommended that you place your csv file in directory where your jmx file is present. Encoding of file, and the most important are your variables. Name the variables in sequence as they are in csv files. I have taken only two variables username and password and my csv file data is also in same sequence.
If you want to use more than 1 csv data set config element in your thread group then it is possible but you need to make sure that the variable names should not repeat in your thread group.
Now to access the variable in your Http Request, you can simply access these variable using syntax: ${Variable_Name}.
Have a look how I have modified my post body in http request sampler to access input from csv file.
I have replaced the values of username and password with ${USERNAME} and ${PASSWORD}.
Listeners
Listeners are the elements where you actually see the results of your test. There are various listeners available with JMeter. But for API we actually need View Result Tree Listener, Graph Result, Aggregate Graph, Aggregate Result. To add listener right click on thread group go to Add –> Listener
1 View Result Tree Listener
If you are interested to see the input provided and output of each request sent to server then View Result In Tree Listener is best.
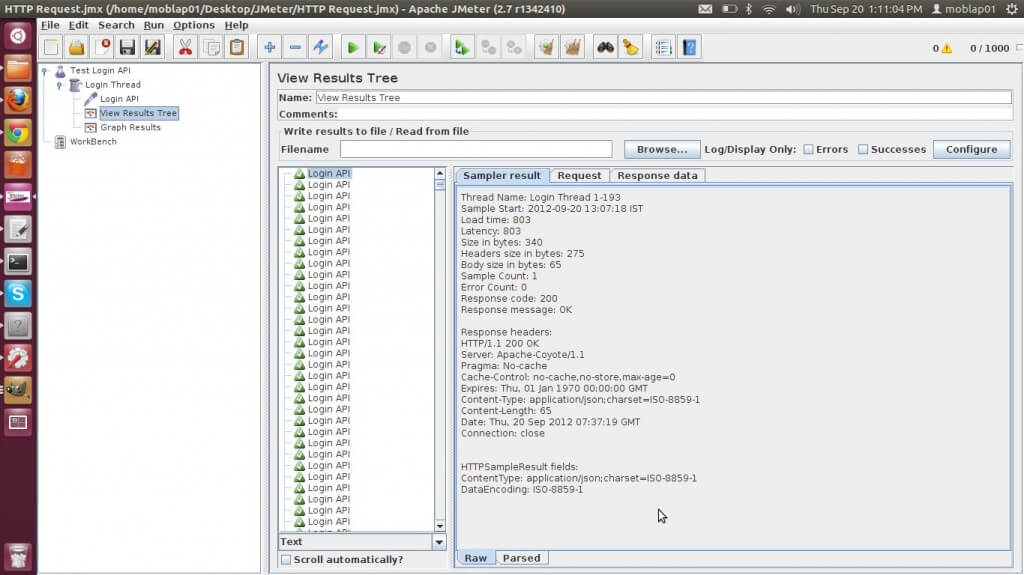
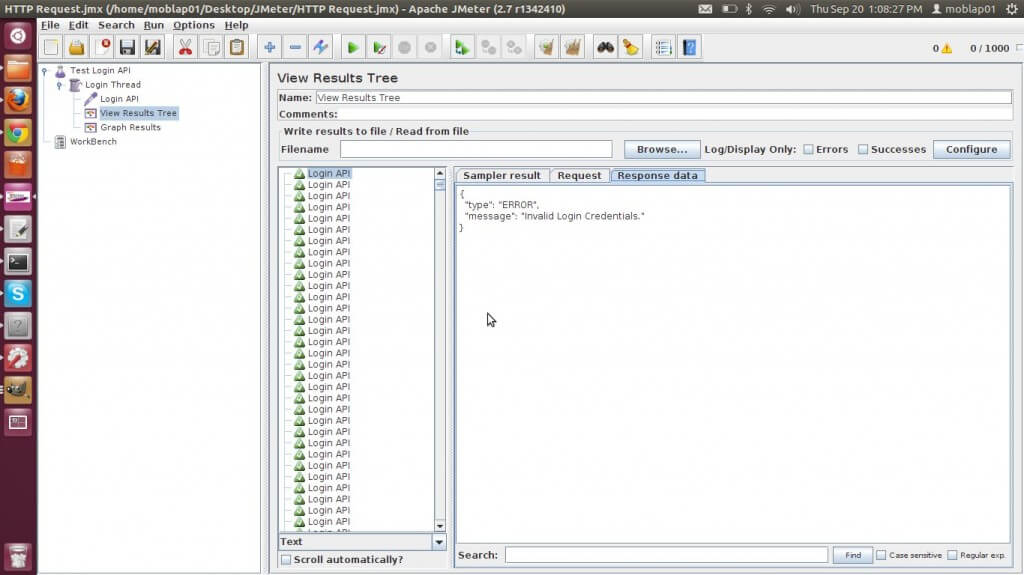
Have a look at View Result In Tree Window. In left side of window you will see the APIs executed if they are in green color then API executed successfully and if they are in red color then API execution had some problem, you can see the reason in the right frame of window.
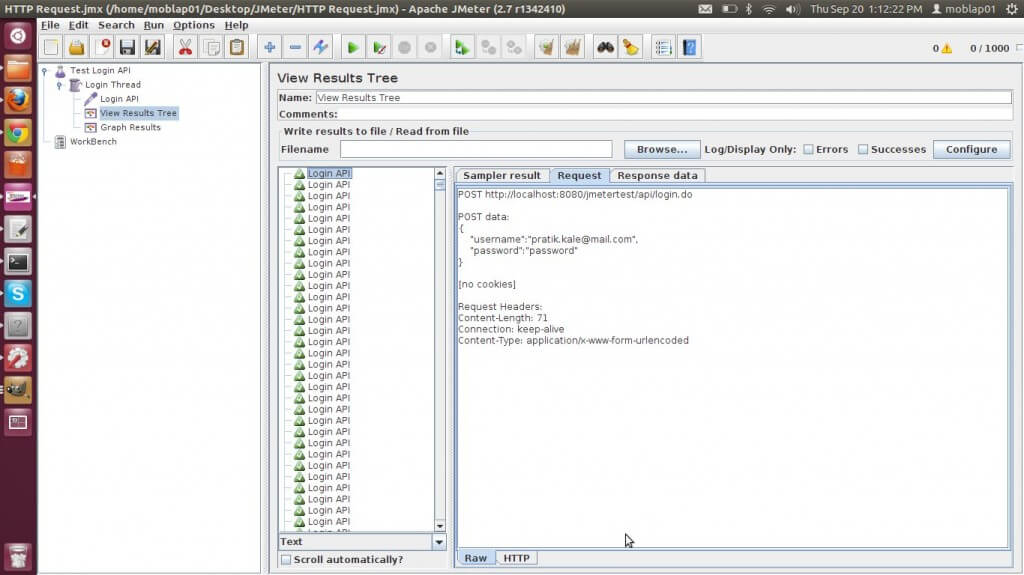
In Sampler result tab you can see all the details of http response by server. In Request tab you can see http url hit and data posted with the request, and in response tab you can see the response data of request. All these are shown in below screen shots.
Sampler Tab
Request tab
-
Response Tab
2Graph Result Listener
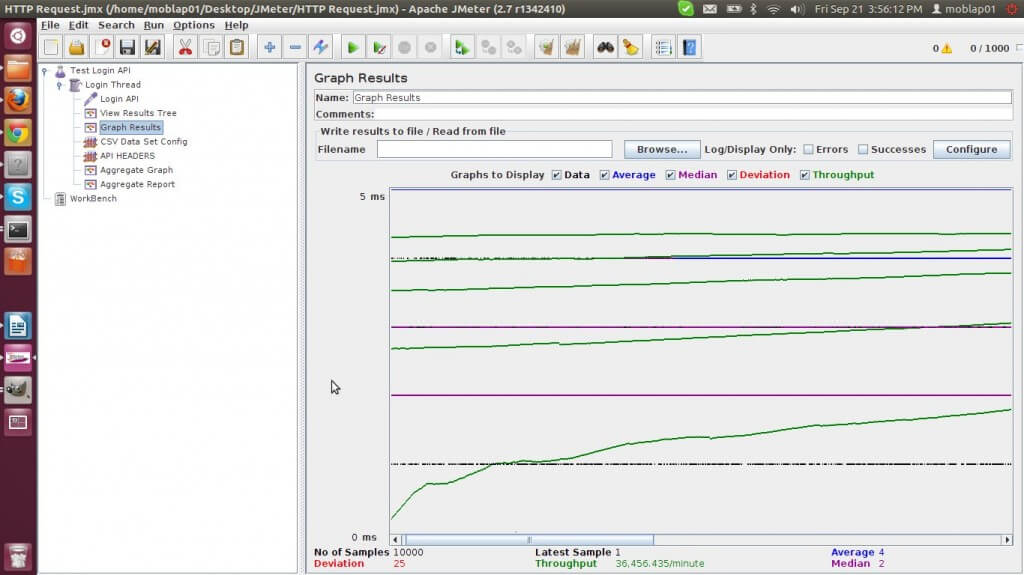
You can see your result in graph result listener, sample screen shot shown below
3 Aggregate Result Listener
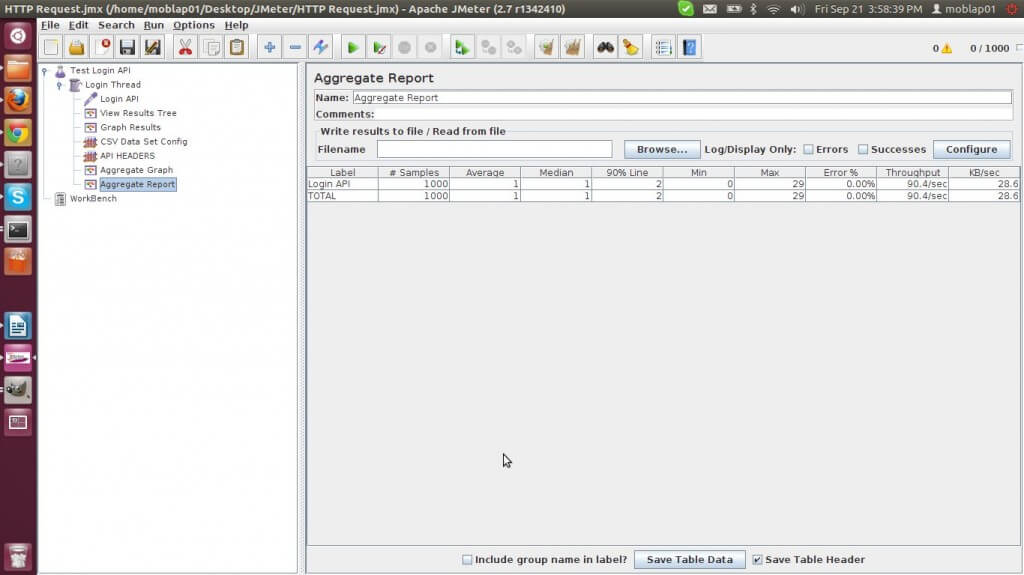
This listener will show you the results in table format where you can see various parameters of the result. First is samples means number of request execute on server, second is Average that is average time of request executed for all samples, then median is average time in middle of a set of result, then min is shortest time of this sample to execute and max is maximun time taken by any sample to execute, then error % is percentage of errors, throughput is requests per second and KB/sec is throughput measured in kilobytes per sec.
Sample Aggregate report
You can download sample jmx file and csv file of my loginApi from here Sample_Example.
References:
