Introduction
Docker has revolutionized the way developers build, ship, and run applications. With the power of containerization, Docker enables applications to run consistently across different environments. However, as containerized applications become more complex, monitoring Docker containers' performance and health becomes a critical task. Without proper Docker container monitoring, it's challenging to ensure that your applications are running smoothly or to troubleshoot issues when things go wrong.
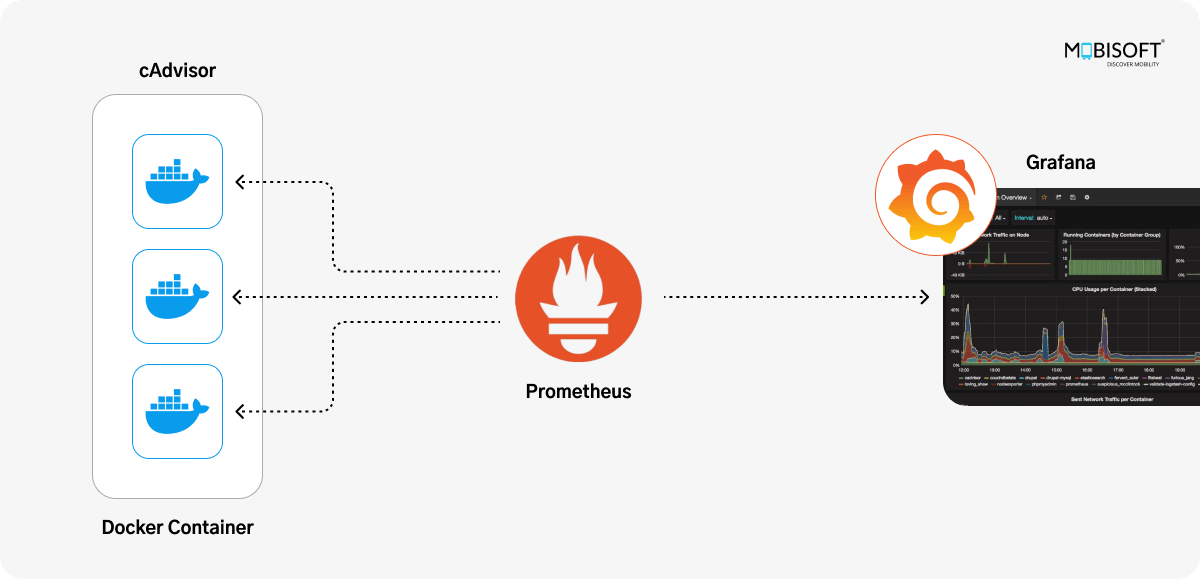
Prometheus and Grafana are two powerful tools that, when combined, provide a robust solution for monitoring Docker containers. Prometheus is an open-source systems monitoring tool designed for reliability and scalability. It can collect and store metrics from various sources, including Docker containers. Grafana, on the other hand, is a popular open-source data visualization tool that integrates seamlessly with Prometheus to create interactive and visually appealing dashboards.

In this blog post, we'll provide a practical example of how to monitor Docker containers using Prometheus and Grafana. We'll guide you through the process of setting up Prometheus to scrape container metrics, using cAdvisor to expose Docker metrics, and visualizing the data in Grafana. By the end of this guide, you’ll be equipped with the knowledge to monitor Dockerized applications in real time and gain valuable insights into their performance.

Prerequisites
Before we dive into the setup, make sure you have the following prerequisites:
1. Docker: You should have Docker installed on your machine. Docker will be used to run Prometheus, Grafana, and cAdvisor as containers.
2. Docker Compose: Docker Compose allows you to define and manage multi-container Docker applications with a single YAML configuration.
3. Basic Understanding of Prometheus, Grafana, and Docker: While this post will walk you through the setup, a basic understanding of how these tools work will help you make the most of this tutorial.
Step 1: Set Up Docker Compose
To simplify the deployment process, we’ll use Docker Compose to run Prometheus, Grafana, and cAdvisor in separate containers. First, let's create a docker-compose.yml file that will define all the necessary services.
Create the docker-compose.yml File
version: '3'


services:
 cadvisor:
  image: google/cadvisor:latest
  container_name: cadvisor
  volumes:
   - /:/rootfs:ro
   - /var/run:/var/run:ro
   - /sys:/sys:ro
   - /var/lib/docker/:/var/lib/docker:ro
 ports:
  - "8080:8080"

  prometheus:
   image: prom/prometheus:latest
   container_name: prometheus
   volumes:
    - ./prometheus.yml:/etc/prometheus/prometheus.yml
  ports:
   - "9090:9090"

  grafana:
   image: grafana/grafana:latest
   container_name: grafana
   environment:
    - GF_SECURITY_ADMIN_PASSWORD=admin
  ports:
   - "3000:3000"
  depends_on:
   - prometheus
Explanation of the Services:
1. cAdvisor:
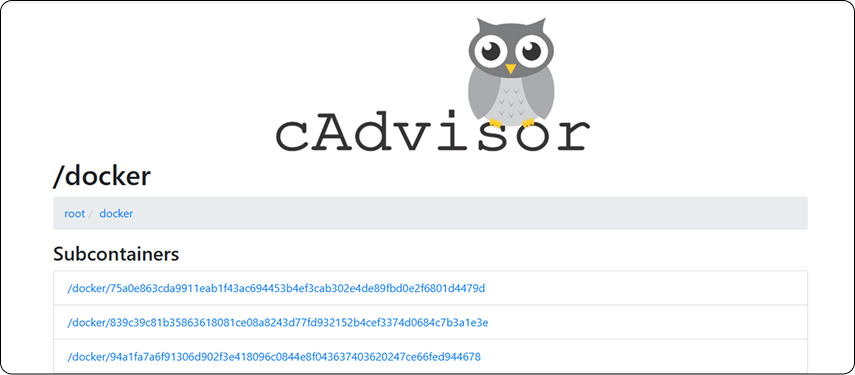
- cAdvisor (Container Advisor) is an open-source tool that provides real-time monitoring of Docker containers. It collects various metrics like CPU, memory, disk, and network usage for each container running on the Docker host.
- The service will be accessible on http://localhost:8080.

2. Prometheus:
- Prometheus is responsible for scraping the metrics exposed by cAdvisor and storing them in its time-series database. It is configured to scrape metrics from cAdvisor using the prometheus.yml configuration file (which we’ll set up shortly).
- Prometheus will be accessible on http://localhost:9090.
3. Grafana:
- Grafana will be used to visualize the metrics collected by Prometheus. We’ll configure Grafana to connect to Prometheus as a data source and create dashboards for visualizing the Docker container metrics.
- Grafana will be accessible on http://localhost:3000.
Step 2: Configure Prometheus (prometheus.yml)
Prometheus needs to know where to scrape the metrics from. To do this, we’ll create a prometheus.yml file that specifies how Prometheus will scrape data from cAdvisor.
Create the prometheus.yml File
global:
 scrape_interval: 15s

scrape_configs:
 - job_name: 'docker'
  static_configs:
   - targets: ['cadvisor:8080']
Explanation of the Configuration:
- scrape_interval:This defines how often Prometheus scrapes data from the target (cAdvisor in this case). We’ve set it to 15s, meaning Prometheus will scrape Docker container metrics every 15 seconds.
- scrape_configs:This section defines the list of targets Prometheus should scrape. Here, we specify cAdvisor running on port 8080 within the same Docker network.
Step 3: Start the Services
With the docker-compose.yml and prometheus.yml files in place, we can now start the containers using Docker Compose.
Run the following command in the terminal:
bash
⇒ docker-compose up -dThis command will download the necessary Docker images (if not already downloaded) and start the Prometheus, Grafana, and cAdvisor containers in detached mode. You can check that the containers are running by using:
bash
⇒ docker psYou should see the following containers:
- cadvisor
- prometheus
- grafana
Step 4: Access Prometheus and Grafana
1. Prometheus: Open http://localhost:9090 in your browser. This is where you can manually query the metrics that Prometheus is scraping from cAdvisor.

2. Grafana: Open http://localhost:3000 in your browser. The default username is admin, and the password is also admin (we set this in the docker-compose.yml file).
Step 5: Configure Grafana to Use Prometheus as a Data Source
Now that Grafana is up and running, we need to configure it to use Prometheus as a data source.
Steps to Configure the Data Source in Grafana:
1. Log in to Grafana (admin/admin).
2. In the left sidebar, click on the gear icon (Configuration) and select Data Sources.
3. Click Add Data Source.
4. Select Prometheus from the list of available data sources.
5. In the URL field, enter http://prometheus:9090 (since both Prometheus and Grafana are running in the same Docker network).
6. Click Save & Test to verify the connection.
Grafana is now configured to use Prometheus as its data source.
Step 6: Import a Grafana Dashboard for Docker Metrics
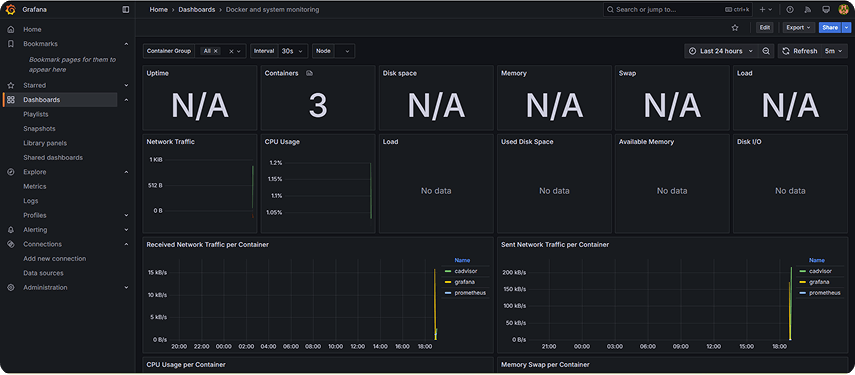
To make things easier, we can import a pre-configured Grafana dashboard for Docker monitoring metrics. Grafana has a variety of community-created dashboards, including one specifically for Docker container monitoring.
Steps to Import the Dashboard:
1. In Grafana, click on the "+" icon in the left sidebar and select Import.
2. In the Grafana.com Dashboard field, enter the dashboard ID: 893 (this is a popular Docker monitoring dashboard).
3. Click Load.
4. Select Prometheus as the data source.
5. Click Import.
This will import a ready-made dashboard that shows useful metrics like CPU usage, memory usage, network I/O, and disk I/O for each running container.
Step 7: Querying Prometheus for Docker Metrics
In addition to the pre-configured Grafana dashboard, you can manually query Prometheus to gather specific metrics for Docker containers. Here are a few example Prometheus queries that you might find
CPU usage:
prometheus
⇒rate(container_cpu_usage_seconds_total{job="docker"}[5m])- This query returns the rate of CPU usage per container over the last 5 minutes.
Memory usage:
prometheus
⇒container_memory_usage_bytes- This query returns the memory usage in bytes for each container.
Disk usage:
prometheus
⇒container_fs_usage_bytes- This query returns the total disk usage by containers.
Network usage:
prometheus
⇒container_network_transmit_packets_dropped_total- This query returns the rate of data transmission for each container.

Step 8: Setting Up Alerts (Optional)
Prometheus and Grafana also allow you to set up alerts for various metrics. For example, you can set an alert for when CPU usage exceeds a certain threshold.
Steps to Set Up Alerts in Grafana:
1. Go to the Docker Metrics Dashboard in Grafana.
2. Click on the panel where you want to set the alert (e.g., CPU usage panel).
3. Click on the Alert tab.
4. Configure the alert conditions (e.g., if CPU usage exceeds 90% for 5 minutes).
5. Set the notification channel (e.g., email, Slack).
Conclusion
In this tutorial, we set up a powerful monitoring solution for Docker containers using Prometheus and Grafana. We:
1. Configured Prometheus to scrape metrics from cAdvisor.
2. Set up Grafana to visualize those metrics through pre-configured dashboards.
3. Learned how to query Prometheus for specific container metrics and set up alerts for real-time monitoring.
By leveraging these tools, you can gain deep insights into the performance and health of your Docker containers. Docker monitoring is crucial for maintaining system reliability, identifying bottlenecks, and ensuring that your applications run smoothly. With Prometheus and Grafana, you have the flexibility to create custom dashboards and alerts tailored to your specific needs.
As you continue to monitor your Docker containers, you can further customize your setup by adding more complex queries, creating more granular dashboards, or integrating additional prometheus monitoring tools.


 February 21, 2025


