Monitoring Redis workloads on Amazon ElastiCache is crucial for optimizing performance and ensuring efficient operations. This comprehensive guide dives into the collaboration between Amazon CloudWatch and ElastiCache, providing insights into performance monitoring fundamentals, latency, and best practices for achieving optimal performance.
The major motive of this blog is to monitor your Redis workload from the server perspective, hence the discussion is focused mainly on how you can observe and understand how your Amazon ElastiCache cluster is performing based on various server-side metrics and what they mean. All of the metrics we'll be discussing today are accessible through Amazon CloudWatch.
Monitoring Your Resources with Amazon CloudWatch and ElastiCache
Monitoring refers to the process of observing, collecting, and analyzing diverse metrics, logs, and data points to ensure the health, performance, and efficiency of different components within a deployment environment. It encompasses various aspects such as resource utilization, data analysis, setting up alerts, spotting operational patterns, and taking actions to proactively identify issues, optimize configurations, and maintain reliable operations.
Amazon CloudWatch and Amazon ElastiCache provide a holistic monitoring approach, catering to general AWS resource monitoring as well as specialized monitoring tailored to AWS infrastructure and caching setups.

What is Amazon CloudWatch used for?
Amazon CloudWatch is primarily utilized for monitoring, analyzing, and managing AWS resources and applications. It provides a robust Redis monitoring and observability platform for AWS services, aggregating and analyzing a diverse range of metrics and logs throughout the ecosystem.
What is Amazon ElastiCache for Redis used for?
Amazon ElastiCache is primarily used as a managed in-memory caching solution for enhancing application performance, resilience, scalability, and responsiveness of clusters. It is specifically designed for caching Redis workloads and contributes to performance monitoring by offering detailed visibility into caching-specific metrics like latency, throughput, node health, and scalability.
With Amazon CloudWatch, you can collect performance data from every Amazon ElastiCache node in your project clusters every 60 seconds. This allows your DevOps teams to understand what might be impacting performance, set alarms based on thresholds that correspond to their workloads, and more.
In addition, monitoring Redis workloads encompasses two significant aspects. Here is a detailed explanation.
Types of Redis Monitoring a Managed Service
There are two key aspects of monitoring:
#1 ElastiCache Monitoring
This aspect is handled by Amazon ElastiCache itself. As a fully managed service, it takes care of monitoring the health and availability of your Redis clusters and nodes. It automatically detects node failures and takes action, such as replacing a failed node and resynchronizing it with the cluster.

#2 Customer Monitoring
This aspect focuses on the overall utilization and performance of your ElastiCache cluster. Since every workload is different, you need to monitor specific metrics that are relevant to your application's performance. For example, in a caching workload, metrics like evictions that impact available memory may be important, while in a Redis Pub/Sub or Stream workload, other metrics may take priority. Monitoring allows you to track these metrics and ensure optimal performance for your specific workload.

It involves monitoring key metrics at both the host level and the engine level so that you can identify if your nodes are overutilized or underutilized and take appropriate actions such as scaling up or down to optimize performance and cost efficiency. Let's get into it in detail.
- Host Level:
Each Amazon ElastiCache cluster consists of one or more Amazon EC2 compute nodes. These nodes emit host-level metrics such as CPU utilization, memory usage, and network activity. These metrics are important even if you're not using ElastiCache, as they provide insights into the overall performance of the underlying infrastructure on which ElastiCache runs.
- Engine Level:
The second set of metrics is derived from the Redis engine itself. These metrics provide insights into the performance and efficiency of the Redis engine. Examples of engine-level metrics include CPU and memory efficiency, command execution latency within the engine, the impact of data replication on performance, connections, keyspace, and operations.
Thus, effective monitoring of ElastiCache performance empowers you to ensure the smooth operation of your applications and make informed decisions to enhance performance and resource management. Now, let’s talk about key metrics to consider when monitoring Redis workloads.
All About Latency and Performance Monitoring
Latency is a crucial measurement when monitoring the performance of your ElastiCache cluster. It refers to the time taken for a request to be sent and a response to be received. Amazon ElastiCache for Redis is designed to provide sub-millisecond access to data across the network and microsecond latency within the Redis engine for many operations.
Understanding Metric Values
It's important to note that a high metric value or approaching a maximum value does not necessarily indicate a problem with the cluster's performance.
For example, in a caching use case, operating at high memory utilization is desired for optimal performance as it allows for maximum utilization of memory to store pre-computed query results. Despite high memory usage, latency can still be low.
Conversely, even if key metrics such as memory utilization and network utilization are not trending high, you can still experience latency. This can occur if you're running commands with high time complexity, resulting in high CPU utilization.
Another scenario is when ElastiCache for Redis processes data quickly that it utilizes 100% of the available network capacity, leading to high network utilization despite low memory and CPU usage.
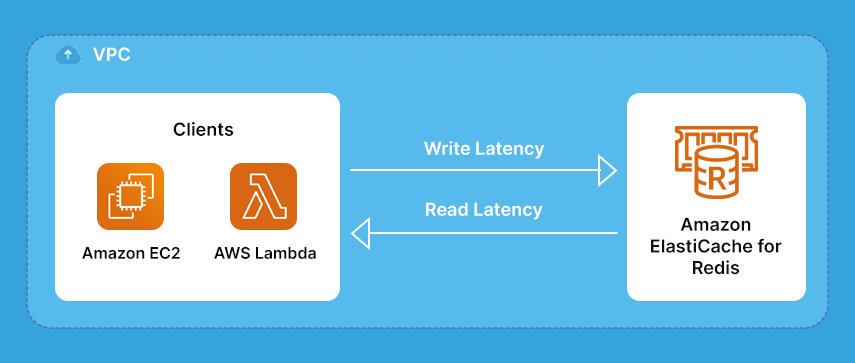
Amazon ElastiCache emits useful metrics related to command latency, which measures the time it takes in microseconds to execute specific commands as shown below:
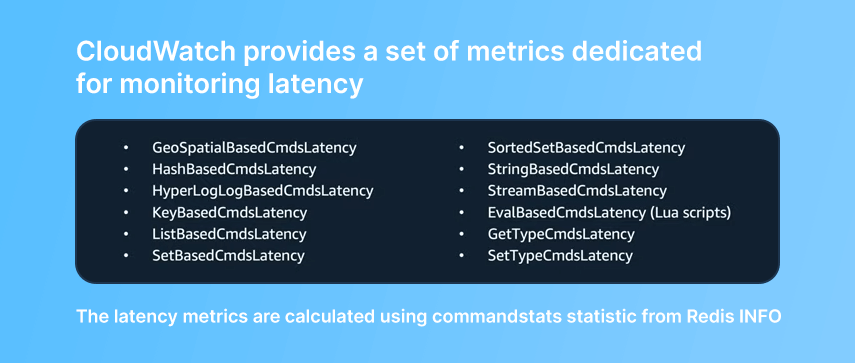
You can notice a particular pattern: they all have the term "commands latency" attached to them. These metrics can help investigate poor performance from an application or user perspective.
Setting CloudWatch alarms on these metrics can provide insights into different aspects of performance, such as evaluating the latency associated with eval-based commands or monitoring set-type and get-type commands latency.
For instance, you might see a high value associated with eval-based commands latency, and that's associated with Lua scripts running on the server. Lua scripts can be useful when you want to run logic on the server where it's close to the data, rather than processing it on the client. However, Lua scripts will typically run until they're completed execution, and since Redus is single-threaded, a Lua script can block the Redis engine from running any other commands until it finishes.
So two of the most helpful metrics are set-type commands latency and get-type commands latency.
- Set-type commands latency measures the latency of commands that mutate or modify data in some way like setting a string to a value, updating a hash, adding a new entry into a geospatial index, and so forth.
- Get-type commands latency measures the latency of read-only commands such as getting the value of a string, fetching a field from a hash, and so on.
These two metrics give an understanding of how write and read workloads are performing across different data structures in Redis. High get-type command latency may indicate the need to scale the number of replicas in your cluster, while high set-type command latency may suggest scaling the cluster horizontally by adding more shards to increase write capacity.
These latency metrics are specific to the execution times within the Redis engine itself and do not include network latency. They provide insights into the internal performance of the Redis engine and can help optimize your ElastiCache cluster for better overall performance.
So What Impacts Latency? Key Components to Monitor
Since we're focusing mostly on the ElastiCache service and the performance of its clusters, we're going to focus on the fundamental components to monitor the Redis workload. Let’s check the key components to monitor performance.

#1 CPU:
CPU utilization is an important metric to monitor as it can have a significant impact on latency. Redis is a single-threaded process, so keeping an eye on CPU usage is crucial. Monitoring CPU utilization can provide insights into how much pressure is being placed on the Redis engine itself.
#2 Network Capacity:
Network capacity can vary depending on the type of ElastiCache node selected for your cluster. As ElastiCache for Redis can read from memory and write to memory without fetching data from disk, it has a higher chance of reaching the maximum network capacity of the cluster than a disk-based database might.
#3 Memory
Memory is a critical component to monitor for in-memory data stores and caches like Amazon ElastiCache. As you approach the maximum memory available in a Redis cluster, the Redis engine needs to start keeping track of memory more closely and may start evicting keys. This adds additional CPU time to each cycle.
#4 Connections
Client connections can also impact performance. Monitoring client connections can provide insights into how much pressure is being placed on the Redis engine to manage client connections.
There are two primary metrics associated with CPU that are important to monitor:
- Engine CPU Utilization
This metric reports the percentage of usage on the Redis engine core. Since Redis is single-threaded, this metric is a good indicator of how much pressure is being placed on the Redis engine itself.
- CPU Utilization
This metric reports the percentage based on all vCPUs on the node. For example, if you have four vCPUs and the Redis engine is utilizing 100% of its dedicated core, this metric might be closer to about 25%.
However, if you're running Redis version 5.0.3 or newer and your node type has four vCPUs or more, then ElastiCache makes use of those extra vCPUs by enabling enhanced I/O. This offloads the connection management of clients from the Redis engine to other threads.
When your system experiences higher CPU utilization, it often signifies an efficient use of available resources, optimizing their usage to the fullest potential. This condition is typically anticipated and sometimes even desired. However, managing this situation requires a proactive approach, especially in scaling clusters to avoid resource depletion.
“A general rule to follow is to scale your cluster before reaching maximum capacity due to high-engine or overall CPU utilization. To facilitate this, consider setting a warning alert at around 70% of engine CPU utilization. A high alert should trigger at 90%, prompting timely action to prevent hitting 100%.”
Scaling operations introduce additional pressure on the cluster. Migration of keys between nodes during scaling induces CPU overhead and increased network traffic. Therefore, scaling preemptively—well before the need arises—is essential.
Metrics Associated with Network Capacity
As mentioned before, Redis workloads typically consume all network capacity on the cluster nodes. To measure this, we can look at a few metrics associated with Network:
- Network Bytes In: This metric tracks the volume of bytes read from the network at a host level. It's sent to CloudWatch, offering insights into the amount of incoming data to the node.
- Network Bytes Out: This metric measures the number of bytes written to the network. It provides visibility into the outbound data flow from the node.
- Replication Bytes: This metric is exclusive to primary nodes within a cluster and doesn't apply to replica nodes. It quantifies the volume of bytes transmitted from the primary node to its replica nodes.
When observing the primary node, it's essential to consider its multifaceted responsibilities. It handles both read and write requests as well as manages data replication to its read replica nodes.
Understanding these metrics helps in gauging the network utilization and the primary node's workload, aiding in efficient performance optimization and system scaling.
A primary node may use more network resources than its read replicas, when working with write-heavy workloads, it must process and synchronize high volumes of commands, especially when receiving a large volume of commands.
Metrics Associated with Memory
As discussed earlier, memory is a critical piece to the efficient operation of an in-memory data store like ElastiCache. There are a few metrics that we should monitor:
- Bytes Used For Cache
This catchall metric includes memory used not only for the data set but also for buffers and anything else the Redis engine allocates for itself.
- Database Memory Usage Percentage
This is a percentage value that indicates how much memory you have available for your data set in your cluster. When this value reaches 100%, Redis will start to evict data based on the max memory or eviction policy that you've selected. You can count the number of evictions that occur to monitor this metric.
- Evictions
A high rate of evictions may indicate that you haven't allocated enough memory for the cluster. In this case, you can either scale your cluster out by adding another shard of the same size or scale your cluster up to a larger instance type, increasing the amount of memory each node has.
- Swap Usage
This host-level metric indicates how much swap space is being used on your cache nodes. This value should be as low as possible and ideally should be zero, but it should not exceed 50 MB. A high value for this metric indicates that your node is running out of memory and needs to use disk space as temporary memory. This can decrease performance because disk subsystems are slower than memory. To reduce the chance of using swap, you can increase the value in your cluster parameter group called reserve-memory or reserve-memory-%. By default, current versions of ElastiCache for Redis reserve 25% of a node's maximum memory value for non-data purposes such as snapshot backups and failover.
- Freeable Memory
This host-level metric is one of the helpful metrics. It is a good indicator of how much memory the operating system has available if it needs it.
Monitoring these metrics is important to prevent issues related to memory usage on the underlying host that Redis runs on.
Metrics Associated with Connections
Connection management is important in monitoring the performance of your cluster. There are two primary metrics associated with connections -
- Curr Connections
This metric represents the number of concurrent and active connections registered by the Redis engine. It's important to note that Redis has a limit of 65,000 concurrent connections on each node, so if we see a constant increase in this metric, it may eventually lead to the exhaustion of available connections
- New Connections
This metric represents connections that have been accepted by Redis during a specific period, but may not necessarily be active any longer.
For example, you might receive 10,000 new connections in one minute but only have 2,000 concurrent connections because some of those connections may have opened and closed rapidly at different times. Creating connections has a certain amount of overhead for both the client and the server, so a high volume of new connections rapidly opened and closed may have an impact on the node's performance.
To reduce the chance of reaching the maximum number of connections and to reduce unnecessary processing on the server, it's recommended that you reuse existing connections where possible by implementing connection pooling in their client of choice.
Utilities to Monitor Redis Workload
There are a few utilities available with Redis that can help you understand the performance and latency of your ElastiCache for the Redis cluster. These utilities are open source and can be run on any of your Amazon EC2 nodes that have access to your cluster. Let’s deep dive into these utilities:
#1 Redis CLI Commands Land Utility
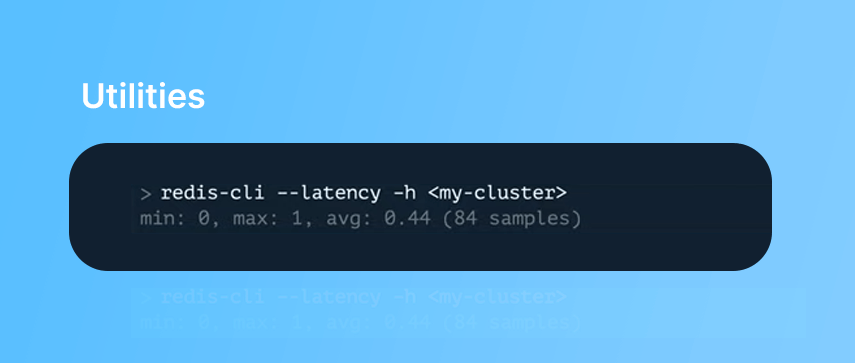
The first utility is built into the Redis-CLI command land utility, which allows you to test for response latency between an EC2 node and the cluster. The location of your client (EC2 node) compared to the location of your server (the cluster) can impact latency, so having them both run within the same availability zone can reduce latency.
#2 Redis Benchmark
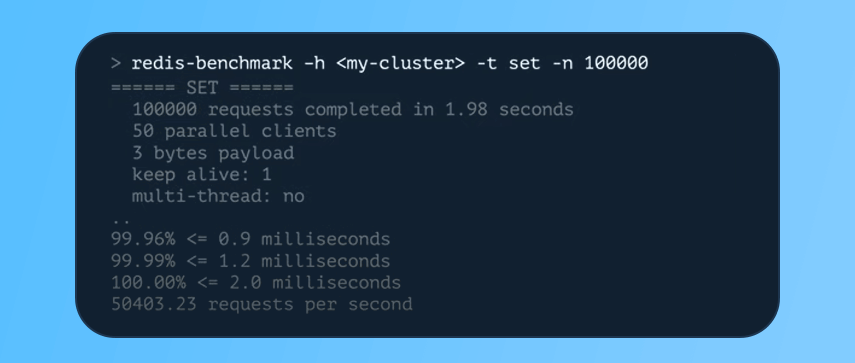
Another utility you can use is Redis-Benchmark, which is a flexible monitoring tool that can be used to test different scenarios. In a simple example with a modest client node, the below image shows the completion of about 100,000 requests in just under two seconds, with over 99% of the requests completed in under one millisecond.
ElastiCache for Redis clusters can provide substantial network capacity, CPU, and memory, and can scale horizontally up to 500 nodes for even faster performance. Monitoring the major hardware components such as CPU, memory, and network is important to understand how they impact the performance of the cluster.
Slowlog Log Delivery Demo
Redis can detect which commands are taking an excessive amount of time to execute. This is done through a feature called the slowlog. The slowlog logs any command that takes longer than a specified time to complete. It stores information such as the command that was called, how long it took to execute, and the IP address of the command that was executed.
Recently, Amazon introduced a new feature in ElastiCache for Redis that allows DevOps engineers to send events from the Redis slowlog to Amazon CloudWatch log groups. This allows your team to monitor and be alerted if a certain number of commands have breached the defined threshold.
Conclusion
We have taken a comprehensive look at the various important metrics that need to be tracked to ensure optimal performance of AWS Elasticache Redis Clusters. Hope that was useful to you.




 November 30, 2023


