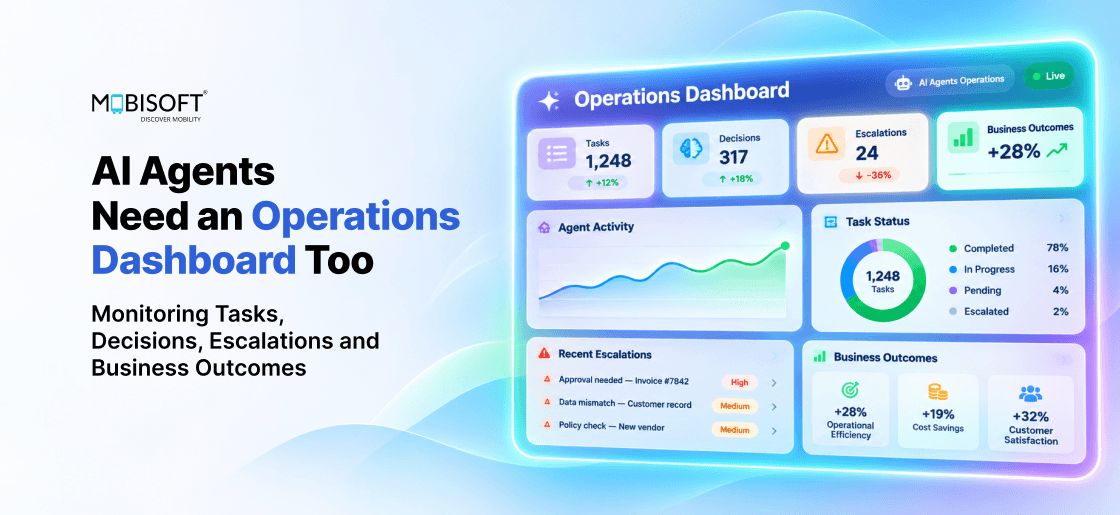
Ask an engineering lead whether the support agent is working. You'll hear about uptime and latency. Ask the COO the same thing, and it means something else. Did the agent resolve the claim, keep the customer, and stay inside policy? The two answers often come from different dashboards.
Most AI agent monitoring today is built for the first question. It catches crashes and slow responses well. It misses the confident reply that closed a ticket without fixing anything. When we deliver AI agent integration services, we wire agent events into CRM and billing data from the start. The COO's question then gets a number.
Getting there doesn't mean replacing your tools. It means deciding which six layers to watch, who reads each view, and how to price the work. Once that's settled, your next dashboard review can serve both people at the table, with numbers each of them trusts.
Why Infrastructure Dashboards Miss What Agents Get Wrong
Application monitoring assumes software either works or throws an error. Agents add a third state. They finish the request, sound sure, and still get the job wrong. Conventional tools log that as a success.
One Hour, Two Dashboards
Here's one hour of traffic seen two ways, with illustrative numbers.
A standard APM panel reads "10,000 requests, p99 latency 340 ms, error rate 0.3%." It's all green. An AI agent operations dashboard covering that hour might read differently.
- 8,740 tasks completed in full.
- 890 handed to humans, 360 of them tagged avoidable.
- 310 ended with a fallback and partial information.
- 50 replies blocked by a compliance check.
- 12 tasks ran past 1.5 times their cost budget.
Which of those lines could you pull up today? The first panel takes seconds. The second usually takes a week of log queries, if the data exists at all.
What AgentOps Adds to Standard Monitoring
AgentOps treats each task as a unit of work with an outcome. A task record might read "refund_request, completed, 4 tool calls, $0.06, no escalation." It shows whether the work finished and which decisions it took. Linked to CRM data, it also shows what the business gained.
None of that appears in uptime monitoring. Could your on-call engineer tell you yesterday's cost per refund? Our guide to monitoring AI agents in production covers launch controls. Here we'll stay with the operations view that keeps watching after go-live.
Better Visibility Often Looks Worse at First
Sinch surveyed 2,527 senior leaders for its May 2026 report, The AI Production Paradox. About 74% had rolled back or shut down a customer agent after a governance failure. Among firms with fully mature guardrails, it was 81%.
Sinch's explanation is worth keeping. Stronger AI agent monitoring let those teams see failures others missed. So when your new dashboard shows success falling from "98%" to "86%," don't panic. That's probably your first honest baseline.
How to Monitor AI Agents in Production: Six Dashboard Layers
A useful AI agent monitoring dashboard answers six questions. Each layer gets its own panel and owner, with alert rules to match. Skip one, and you miss an entire list of failures.
Layer 1: Task Execution
Define each workflow as a task, with completion criteria you'd defend in a review. A request and a reply don't tell you enough. "Customer asked to move a payment date" isn't complete until billing shows the new date.
Outcome Categories Worth Tracking
- Completed in full, with the end state confirmed.
- Completed with a caveat or partial answer.
- Failed with a clear message to the customer.
- Escalated to a person.
- Abandoned by the customer midway.
- Timed out or hit a cost cap.
Track completion by task type and by hour. A drop on one type at one hour often points straight at a tool. These rates are the core AI agent performance metrics for this layer. Say refund completions fall every weekday from 2 to 3 p.m. That's probably a batch job locking the payments database. Need a way to score each outcome? Our post on AI agent evaluation metrics covers how to build judges you can trust.
Layer 2: Decision Audit
Every consequential action deserves a record someone can read months later. We'd log these fields for each one, so AI agent observability extends to decisions as well as errors.
- The input and the retrieved data the agent relied on.
- The tool calls made, in order, with their results.
- The policy or rule that allowed the action.
- The model ID and prompt version in use.
- Who approved it, if a person was involved.
Here's a quick test. Pick a random session from last month. Can you show a regulator why the agent approved that refund? If it takes more than ten minutes, the audit layer isn't finished.
Layer 3: Escalations
Every handoff to a person costs you three ways. The customer waits while a staff member gets pulled in. You also learn that the agent couldn't cope. A queue reading "412 handoffs today, 0 with a reason code" tells you nothing about why. That makes AI agent escalation tracking one of the highest-value panels you can build. It gets its own section below.
Layer 4: Business Outcomes
The agent was funded to move a number. Maybe it was cost per contact. Maybe it was days to process a loan. What did your business case promise, exactly? This layer tracks whether that number moved because of the agent.
Attribution takes care. A pricing update or seasonal dip can move the same number. We'd keep a small holdout group handled the old way. A readout like "agent group 81% first-contact resolution, holdout 74%" is a number finance will accept. Settling these targets before launch is part of any sound AI implementation strategy.
Layer 5: Cost and Efficiency
Agent costs scale with task complexity as much as volume. A simple FAQ might take 2 model calls. A refund dispute might take 25. Two agents with equal traffic can differ tenfold in spend.
Track cost per resolved task, never cost per request. Watch the tail too. A panel reading "top 1% of tasks = 18% of model spend" usually points to loops or oversized context. Fixing those rarely touches the typical customer.
Layer 6: Security and Scope
This layer's job is spotting behaviour outside the agent's remit. It covers injection attempts in incoming content. It flags personal data in outputs. It also tracks tool calls the agent isn't meant to make. An alert like "support agent called update_credit_limit, 3 times today" needs a human within minutes.
AI Agent Escalation Tracking: Where the Savings Hide
In March 2025, Gartner predicted agentic AI would resolve 80% of common service issues by 2029. That figure assumes no human steps in at all. Most deployments sit well short of that today. The gap lives in escalations, and that's where improvement pays back first.
Give Every Handoff a Reason Code
An escalation without a reason teaches you nothing. The agent picks a code at handoff. The person who takes the case confirms or corrects it. A record reading "agent chose knowledge gap, human chose data access" shows the two disagree. That's a labelling gap worth reviewing.
Here's a simple code set for AI agent escalation tracking, with how fixable each usually is.
| Reason Code | Usually Avoidable? | First Fix |
| Phrasing not understood | Yes | Add real variants to tests |
| Knowledge base gap | Yes | Fill in and date the article |
| Missing data access | Sometimes | Add a tool or API |
| Threshold too cautious | Yes | Recalibrate on a sample |
| Customer asked for a person | Rarely | Make the handover smooth |
| Policy guardrail | Rarely | Review false positives |
| Real complexity or distress | No | Keep it human |
The last row matters as much as the first. A bereavement belongs with a person. So does a disputed fraud claim. Automating those would save money and lose customers.
Separate Avoidable From Necessary Handoffs
Once codes exist, split the escalation rate in two. The avoidable share is your improvement backlog. The necessary share feeds staffing plans.
Say the policy agent escalates 17% of contacts. Codes show 9 points are avoidable. Those 9 points carry the savings case. The other 8 tell workforce planning how many specialists to keep on rota.
Watch the Handover Itself
A good escalation passes full context to the person. A bad one makes the customer repeat everything. Count how often the human's first message asks for something the agent already had.
"Sorry, can you confirm your policy number again?" is a measurable failure. We'd count those weekly. It's among the cheapest fixes on the dashboard, since the data's already captured. It also feeds straight into AI agent performance monitoring, because repeated questions add handling time.
How many of your handoffs arrive with a summary the human actually reads?
Choosing AI Agent Evaluation Metrics for Each Audience
One dashboard rarely serves everyone. Engineers want traces, while operations leads want queues. Executives want the business case. Put all three on one screen, and nobody reads it.
Split the Views by Who Acts on Them
We'd build three views over the same data. Each one shows only numbers its audience can act on that week. Who in your team would change a decision based on p99 latency?
| Metric | Owner | Review |
| Task completion by type | Ops lead | Daily |
| Avoidable escalation rate | Ops lead | Weekly |
| Tool error and loop rate | Engineering | Daily |
| Cost per resolved task | Engineering | Weekly |
| Policy breach rate | Risk | Weekly |
| Outcome vs holdout | Executive sponsor | Monthly |
These are the AI agent evaluation metrics most teams end up keeping. Notice that latency isn't on the list. It belongs on the engineering view, but it rarely changes a business decision.
Score Quality on a Sample, Every Day
Completion rates tell you the task finished. They can't tell you it finished well. A reply reading "Your claim is noted" may close the task and still leave the customer guessing. To judge quality, score a daily sample of conversations against a rubric.
An automated judge can score most of the sample. A person reviews a smaller slice to keep the judge honest. A weekly note like "judge and reviewer agreed on 47 of 50" tells you the automated scores are usable. Agreement below about 85% means it's time to recalibrate the judge.
Alert on Trends, Not Only Thresholds
Fixed floors catch sudden breaks, and slow drift slips under them. Pair each floor with a rate-of-change rule.
Say completion for address changes slides from 93% to 88% across a week. It never crosses an 85% floor. A trend alert still fires on day four. Which would you rather learn from, the alert or next month's complaint data?
AI Agent Governance: Build the Audit Trail Before You Need It
Governance feels like paperwork until someone asks why the agent did something. It might be a regulator or an auditor. More often it's an angry customer. At that moment, the audit layer either exists or it doesn't. AI agent governance is mostly logging decisions while they're cheap to capture.
What the Rules Point Toward
Requirements vary by sector and country. Treat the table below as orientation, and take specifics to legal review.
| Rule | What It Asks | Dashboard Evidence |
| EU AI Act, Art. 26 | Monitoring, human oversight, logs kept for 6+ months | Audit store, reviewer IDs |
| GDPR, Art. 22 | Human intervention on significant automated decisions | Escalation path, override log |
| FCA Consumer Duty | Monitoring of retail customer outcomes | Outcome and fairness panels |
Timing matters for the EU rules. After the Digital Omnibus, Article 26 duties reach Annex III systems like credit scoring from 2 December 2027. Whether your agent falls under Annex III at all is the first question for counsel. None of these rules prescribes a dashboard. Each is far easier to meet with one.
Turn Policy Into Monitored Rules
A written policy nobody checks is only a hope. So convert each rule into something the dashboard can count.
Take a line like "Agent may issue refunds up to $200 without approval." It becomes a monitored limit. Any refund above $200 with no approver ID fires an alert.
We'd keep a short register linking each policy line to its metric and owner on the AI agent operations dashboard. When a policy changes, the register shows which alerts need updating. Without it, rules and monitoring drift apart within a quarter.
Check Fairness Across Customer Groups
Averages can hide uneven treatment. Compare AI agent performance metrics like completion and escalation across segments you're allowed to analyse. Language and region are common choices.
Suppose the risk view reads "Welsh-language escalations 24%, English 9%." The agent may simply understand Welsh less well. That's a quality gap with a fairness angle. The risk owner needs to see it alongside engineering.
Could you produce that comparison for last quarter if asked tomorrow?
The Telemetry Layer Underneath the Dashboard
No AI agent monitoring dashboard can show data the agent never emitted. So event design comes first, ideally before the agent ships. Add it later, and you're guessing about sessions you can't replay.
A Minimum Event Set
We'd have every agent emit these events, each tagged with a task ID.
- A start event carrying intent and customer segment.
- Every model call with its model ID and prompt version.
- Every tool call with its result status and duration.
- Each consequential decision, plus the rule that allowed it.
- Escalations carrying a reason code and the context handed over.
- An end event recording outcome category and total cost.
One event in that stream might read "task 88213, get_policy, timeout after 8 seconds." Alone, it's trivia. Joined to the outcome event that follows, it explains a failed renewal. Can your current logs make that join?
Write Once, Read Many Times
Send events to a stream first. Then let each consumer read the same feed. The live dashboard and alerting service both take it. The audit store does too, along with the eval pipeline that turns failures into tests. Nobody rebuilds logging when a new use appears.
Keep the audit copy immutable. An auditor's first question is often "who could change this record?" The answer needs to be nobody.
Use Open Conventions Where They Exist
OpenTelemetry's GenAI semantic conventions define spans such as invoke_agent and execute_tool. They were still in development status in mid-2026. Expect some attribute names to move. We'd adopt them anyway. They keep AI agent monitoring data portable if you change AI agent observability tools later.
Buy a Platform or Build a Custom AI Agent Monitoring Dashboard?
The tooling market grew fast through 2025 and 2026. Most teams now pick one of three routes. The choice depends less on budget than on how unusual your business metrics are.
What Platforms Cover Well
Commercial and open-source AI agent observability tools handle tracing and evals well. Most manage prompt versions too. You'll often see these names on a shortlist.
- Langfuse, which is open source and can be self-hosted.
- LangSmith, from the LangChain team.
- Arize Phoenix, an open-source tracing and evaluation tool.
- Datadog LLM Observability, for teams already on Datadog.
They're strong on the engineering view. Business outcomes are harder for them. They can't see your CRM or billing data, and they don't know your holdout groups.
Three Routes Compared
A quick scan of the trade-offs helps before any vendor demo. "Can it show cost per resolved claim?" is a fair first question for each.
| Factor | Platform | Custom Build | Hybrid |
| First useful view | Weeks | Months | Weeks |
| Engineering effort | Low | High | Medium |
| Business metrics | Limited | Full | Full |
| Lock-in risk | Medium | Low | Low |
Why Hybrid Usually Wins
We'd recommend a platform for traces and evals. Then add a thin custom AI agent monitoring dashboard on top. That layer joins agent events to business data.
Hybrid also limits lock-in. If traces follow OpenTelemetry conventions, you can swap the platform underneath. The business views stay where they are. Which of your key metrics sits in a system your current tool can't read?
AI Agent ROI Measurement: Proving the Agent Pays
Teams often blur two ROI questions. One asks whether the agent delivers its business case. The other asks whether monitoring is worth its cost. The dashboard answers the first. Its own value comes from the fixes it points to.
Measure Against a Human Baseline
Start with cost per resolved task, agent and staff side by side. Count model spend and platform fees. Don't forget the human time spent on escalations.
A fair comparison might read "agent £1.90 per resolved query, staff £18 per handled query." It can't leave out the 17% the agent passed back to people. Then track AI agent business outcomes against the holdout group. Resolution and retention matter more than raw volume.
A Worked Example With Illustrative Figures
Picture a mid-sized insurer whose policy agent handles 3,800 contacts a day. Before proper monitoring, the team guessed escalations ran "around 15%." The new dashboard showed 17%. Reason codes tagged 9 of those points as avoidable. Model spend was also about £8,400 a month over budget.
| Line | Year 1 |
| Avoidable escalations cut by 5 points, at £18 each | £1,248,000 |
| Half the model overspend recovered | £50,400 |
| Hybrid dashboard build and platform | −£120,000 |
| Engineering time for the fixes | −£90,000 |
| Net benefit | About £1,088,000 |
Notice the team only targets 5 of the 9 avoidable points in year one. That's what keeps the case defensible.
Where This Model Can Mislead
Each line rests on something outside the dashboard.
- Fewer escalations save money only if staffing plans change. Otherwise, the saving stays theoretical.
- AI agent monitoring finds problems, but people still fix them. That's why engineering time sits in the costs.
- A high starting escalation rate flatters the result. Teams already near 6% won't see gains this large.
If the escalation line alone covers every cost, the work's probably worth doing. Would your CFO accept that version with your own numbers?
A 12-Week Path From Blind Running to Full Visibility
You don't need every layer on day one. A phased rollout puts useful numbers in front of people early. Each phase also helps fund the next.
Weeks 1 to 3: Telemetry and Task Outcomes
Add the minimum event set to the agent. Then define outcome categories for your five busiest intents. By week three, the ops lead can see daily completion rates. Expect a surprise. "We assumed 95%, it's 84%" is a typical first readout.
Weeks 4 to 6: Escalations and Decision Audit
Roll out reason codes and the handover check across every escalation path. Stand up the immutable audit store and point each decision event at it. Then run the ten-minute test on a random session. Does the trail hold up?
Weeks 7 to 10: Business Outcomes and Cost
Join agent events to CRM and billing data. Set up the holdout group and the cost-per-resolved-task panel. This is where the executive view starts to earn its place. It's also when AI agent ROI measurement stops being a spreadsheet estimate.
Weeks 11 to 12: Governance and Steady State
Map each policy line to a monitored rule. Add fairness comparisons and agree on review rhythms. From here, AgentOps becomes routine work. Give it a named owner and a weekly slot that doesn't get cancelled.
How Mobisoft Infotech Builds AgentOps Dashboards
We help teams move from uptime charts to dashboards that show what their agents achieve. Most of our engagements cover four areas.
- Telemetry design that captures tasks and decisions from the start.
- Hybrid stacks pairing an observability platform with custom business views.
- Links into CRM and ticketing, so outcomes sit beside agent activity.
- Governance mapping that turns written policy into owned alerts.
Mobisoft holds SOC 2 Type II and ISO 27001 certifications. That's worth knowing when your audit store holds customer conversations. We'd still agree on masking and retention with your security team before collecting any.
Start With the Question Your Leadership Asks
When a proper dashboard goes live, one figure almost always falls. Task success that looked like 98% settles somewhere in the eighties. Those failures often keep hiding in standard replies, and in tickets nobody reopened.
Some teams adjust the scoring until the old number comes back. Others take the 84% into the leadership meeting. They walk through where the missing points went and what fixing them is worth. That second group ends up with an agent the business trusts. It usually gets a budget to keep improving it, too.
Good AI agent monitoring won't make your agent look impressive in month one. It makes the conversation about it honest. Each escalation carries a reason, and each decision leaves a record. The COO's question finally gets numbers instead of reassurance.

Frequently Asked Questions
Can Mobisoft Infotech add AgentOps to our live agents?
Yes, usually without rewriting them. We'd wrap each model and tool call, then add a task ID to every event. Your five busiest workflows come first. Within a week, you'd see each task's outcome and cost in AgentOps reports.
How do we set alert thresholds with no baseline?
Run the agent for two weeks in observe-only mode. Record completion by workflow each day. Then you'd set every floor a few points below your quietest normal day. Review them monthly, since early numbers change as real customers find new ways to ask.
Can we monitor a vendor's agent that we can't instrument?
Usually, yes, since most vendors export transcripts or send ticket-outcome webhooks. Pull those into your own store and score a daily sample. You won't see tool calls, but you'll see results. That's enough for useful AI agent monitoring until the contract allows more.
Who reviews our dashboard when a number drops?
Give your ops lead the first look, with engineers as backup. Say completion falls six points overnight on refund requests. They check workflows, then page whoever's on call. Write that order into your AI agent governance policy, so nobody's guessing.
How much should we budget for monitoring itself?
Evaluation and storage both cost money. Say your agent spends $20,000 a month on model calls. A smaller judge reviewing a 10% sample usually adds only a fraction of that. Weigh the total against the escalation savings it'll uncover.
Can Mobisoft Infotech build a custom dashboard on our CRM?
Yes, we'd start with a hybrid build. Keep traces in the observability platform you already pay for. Then join task events to Salesforce or HubSpot records. The result is a custom AI agent monitoring dashboard with cost per resolved claim.
This content is for informational purposes only and may include AI-assisted research or content generation. While we strive for accuracy, information may evolve over time. Readers are advised to independently verify critical information before making decisions.

Nitin Lahoti
Read more
Nitin Lahoti is the Co-Founder and Director at Mobisoft Infotech. He has 15 years of experience in Design, Business Development and Startups. His expertise is in Product Ideation, UX/UI design, Startup consulting and mentoring. He prefers business readings and loves traveling.
 Nitin Lahoti
 November 2, 2026