Publishing regular blog posts and articles has been the defacto content marketing strategy for most brands and businesses. Unfortunately, in the mad race to gain quick search traffic with keyword targeted blogs, content quality has gown down and often become repetitive. Don’t get me wrong. Blogs are a very effective content format if done right and will continue to do so. However, I strongly feel that businesses need to mix in new content formats as part of their content and SEO. First a quick overview on what exactly is SEO.
Search Engine Optimization (SEO) is a process of getting the traffic from organic, free, natural or editorial search results on the search engines. It encloses both the creative and technical elements that are required to drive traffic, increase awareness and improve ratings in the search engines. SEO is required to make sure that your website is structured or arranged in a way that search engines understand.
Now let me introduce you to using infographics as a powerful content format to implement a smarter and diverse SEO strategy.
Infographic or information graphic is the graphic visual representation of data, information and knowledge. It is intended to present any information clearly and quickly. In recent years, infographic has become a crucial part of SEO. It is liked and shared three times more than any other type of content.
Infographics in SEO Strategy
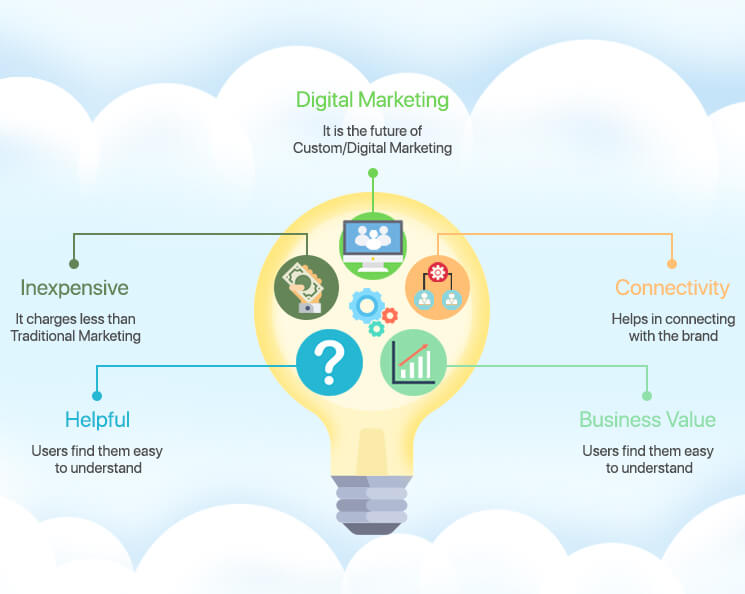
Infographic is an extremely effective tool for content marketing to use in SEO efforts. The reasons are:
- 90% of users find the custom content or infographics helpful
- 78% of CMOs believe that the custom content is the future of digital/content marketing
- Seven out of ten customers have reported that this content helps them to connect with the brand
- Businesses that are allocating over 50% of their budget of lead generation on content marketing have reported the remarkably higher cost per lead
- Content marketing charges are 62% less than the traditional marketing. Plus, it generates three times as many leads
Let us take an example of some big bands that are successfully using infographics. Two such brands are Starbucks and Coca-Cola.
Starbucks
Instagram has almost 400 million actively user. This statistic shows that it is not just a photo-sharing site anymore. It is one of the best mediums to show off the best side of your business to your fans. Big brands have already leveraged the power of video and photo on Instagram platform. This provides visually rich information to the user in simpler to understand manner.
Have a quick look at the infographic of Starbucks posted on Instagram. To connect with the customer and promote its brand, Starbucks continuously bringing in images of its followers and making them the part of its brand story.
Coca-Cola
It is one of the most successful brands in business. Infographic of this brand illustrates the logo produced and development of the product by the Coca-Cola company. They repeatedly advertise their ideology and product with the help of their infographics.
Now that you some knowledge on how big brands are using infographics, let us understand the right approach to create successful infographics. Here is the 6-step approach to doing that:
1 Identifying The Topic
The first step is to identify the topic that your targeted audience is interested in. The topic should highlight the expertise of that company that is creating it and satisfy the interest of the audience at the same time. The ideas for such type of topic can be taken or sourced from various areas such as-
- Keyword research data
- Blog posts of popular industry
- Common questions of customer support/service
- Internal data
2 Select The Type
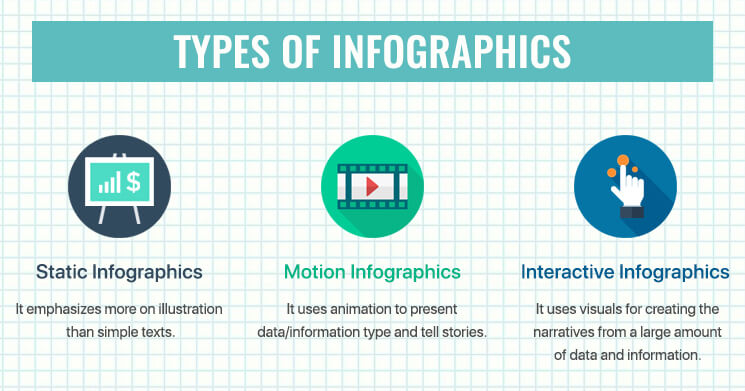
There are three types of infographics to create. You can select it on the basis of your business requirement.
-
Static Infographic:
It is a long scrolling format that is optimized for the viewing on the tablet, desktop, and mobile devices. It emphasizes more on illustration than simple texts. This type is ideal for:
- Delivering an informative and straightforward message
- Sharing the content on social media and websites
- Visual explanations of services and products
-
Motion Infographic:
It uses animation to present data/information type and tell stories. It is ideal for:
- Explaining the detailed systems and processes
- Having complete control over the experience of viewer
-
Interactive Infographic:
It uses visuals for creating the narratives from a large amount of data and information. It is ideal for:
- Visualizing the massive amount of information
- SFocusing on specific information with the track of the big picture
- Engaging the audience via interaction
3 Source The Data Points
The next step is to source the content for the infographics. To achieve this:
- Get data and content from the reputable sources
- Focus on the utilization of the information and data points which are easy to visualize. Such as numeric data or percentages
- You have to be consistent to maintain the single focus on infographics
4 An Effective Design
It is necessary to create a design that is both eye-appealing and effective. It should attract the consumers and convince them to interact with the site. Here are some elements that should be taken care of:
-
Fonts:
To effectively deliver the message, you should use legible text.
-
Spacing:
To avoid the overlapping and cluttered feet, use negative spaces. These spaces will create the breaks between information.
-
Layout:
Maintain the consistent style in infographic to create the flow that would be easy to follow.
-
Minimum Text:
Use text that highlights key points. For making main points, use graphs, illustration, and charts.
-
Icons:
Keep the icons simple. Use them to tell the story.
-
Colors:
Try not to exceed 5 colors on the site. Maintain the uniform feel.
-
Simple Design:
Try to avoid complex designs. These designs draw user’s attention from the points.
5 Establish The Promotional Strategy
You should establish the promotional strategy for both organic and paid marketing plans. It has been seen that the businesses with clear content marketing plan, find their audience quickly. For a proper plan you can consider a few points:
- To target the relevant websites, perform an outreach campaign
- You can have guest post on relevant blogs
- To target your ideal demographic and audience, use paid syndication
- Post on your blog then share across the social media platforms
6Promotional Partners
Next step is to identify the additional promotional partners. It is mandatory to consider the audience’s perspective with whom you want to share the infographics or content with. They can be:
- Niche-relevant blogs and websites
- Influencers in your field
- Business vendors and partners
- Customers
- Journalists and top bloggers within your industry
Below are some ways in which infographics strengthen your brand’s awareness and SEO strategy:
-
Improves Ranking:
With the help of infographics in your content, you can get your web page listed in the search engines’ image search. The Google image search is as powerful as text search. When you put relevant images in your page, chances are high that your search engine’s ranking will improve.
-
Referral Traffic:
If you are including a link with an attractive and compelling infographic then you can pick up traffic. It happens on your site and blog when people “click” or “share” the link.
-
Brand Awareness:
Due to the potential for going viral and being shared, infographics that incorporate company’s brand name or logo can help raise their brand awareness. Interested users or clients can search for their brand after seeing the infographic, or click an attached link to reach their site.
-
Increase Followers:
Infographics can help you to enhance your blog and social media followers by introducing those users to your brand who could not have found out your product otherwise.
-
Recycled:
Information shared in and researched for an infographic can be recycled into the article, white paper, or press release. These can be shared later for inbound marketing endeavors and future content.
At Last,
From the SEO point of view, an infographic will always be one of the favorite strategies. It provides quick measurable results like backlinks, traffic, social shares, and citations. These results allow the SEOs to create the comprehensive ROI reports for clients.
Creating infographics is a creative process. It starts with being familiar with the targeted audience, understanding their problem and requirements, providing them solution along with little entertainment and making sure that they see your messages. After that, the content does the work.
Author's Bio

Shoeb Ahmad, with an experience of 22 years in Digital World, heads Digital Marketing at Mobisoft Infotech. He has a rich experience in SEM, SEO, Social Media & other verticals of Digital Media. He also has been a consultant for a variety of industries, enterprises & startups. He loves reading & traveling. He often writes on various forums since he believes ‘Knowledge increases by sharing.’