In today’s modern Java applications, understanding how requests flow through the system can be challenging. We often encounter issues such as slow response times or unexpected failures, which are challenging to diagnose using traditional logging alone.
This becomes even more complex when working with Spring Boot microservices in distributed environments. That’s where distributed tracing in Java becomes essential. It provides tools to trace the full lifecycle of requests, making it easier to analyze performance and troubleshoot problems in real time.
For businesses building scalable and high performing microservices, investing in custom enterprise web development solutions can help architect observability first systems from the ground up.
Intro: What is OpenTelemetry?
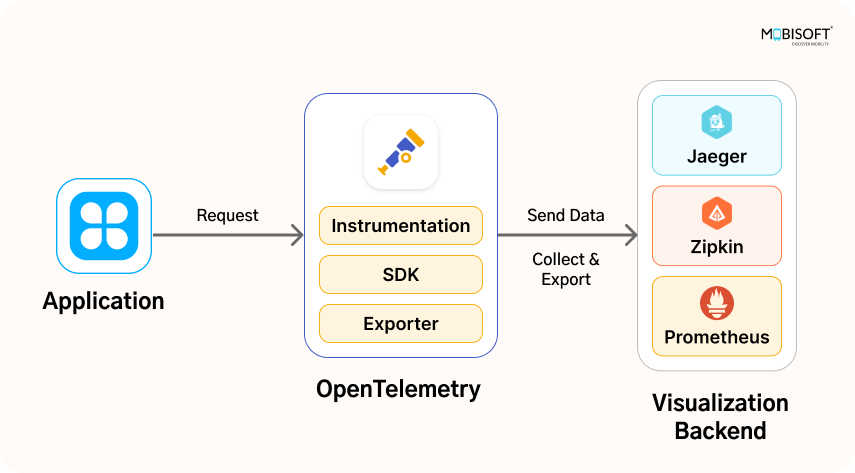
OpenTelemetry (OTel) is an open-source observability framework for Java applications backed by the CNCF. It helps capture:
- Traces (like a request timeline across services)
- Metrics (latency, error rates, etc.)
- Logs (with context)
It’s widely supported and integrates seamlessly with Spring Boot 3, thanks to Micrometer Tracing. For larger teams managing distributed systems, hiring expert Java/JEE developers can greatly accelerate the adoption of robust observability frameworks like OpenTelemetry.
Prerequisites
Before diving into this OpenTelemetry Java tutorial, here’s what we need:
- Java 17+
- Spring Boot 3.1 or later
- Maven
- Docker (for running Jaeger locally)
- Two basic services:
product-serviceandinventory-service
This setup enables you to explore real world observability in microservices using OpenTelemetry with minimal configuration.

Step 1: Add These Dependencies
Add these to both services:
<!-- Spring Boot Actuator for health and metrics -->
<dependency>
  <groupId>org.springframework.boot</groupId>
  <artifactId>spring-boot-starter-actuator</artifactId>
</dependency>

<!-- Micrometer bridge to OpenTelemetry -->
<dependency>
  <groupId>io.micrometer</groupId>
  <artifactId>micrometer-tracing-bridge-otel</artifactId>
</dependency>

<!-- Export traces to OTLP (which Jaeger understands) -->
<dependency>
  <groupId>io.opentelemetry</groupId>
  <artifactId>opentelemetry-exporter-otlp</artifactId>
</dependency>
No need for manual setup – Spring does the heavy lifting.
Step 2: Add the below configuration
Here’s the only config that needs to be added to application.properties in both services:
management.endpoints.web.exposure.include=health, info, metrics, trace
management.tracing.sampling.probability=1.0
management.otlp.tracing.endpoint=http://localhost:4318/v1/traces
management.tracing.propagation.type=W3CNote: sampling.probability=1.0 means “trace everything.” Works best for dev, not ideal for prod.
Step 3: Spin Up Jaeger in Docker
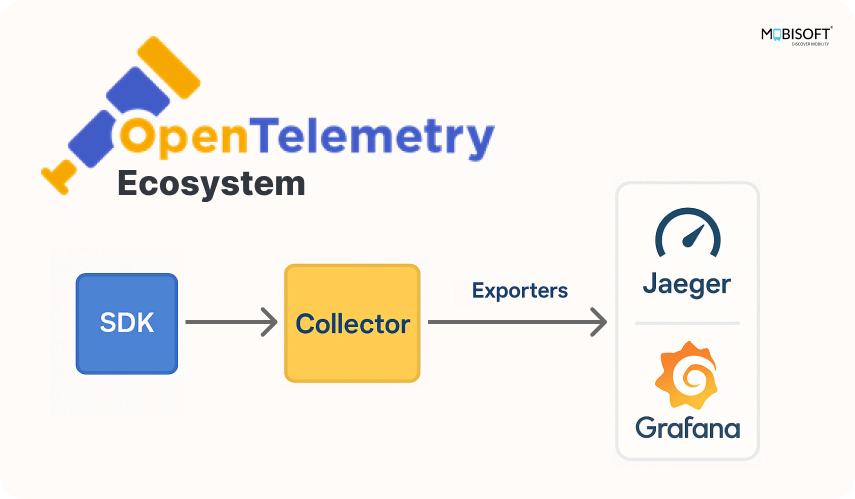
Jaeger is the place where we’ll see our traces. Just run the below command:
docker run -d --name jaeger -p 16686:16686 -p 4318:4318 jaegertracing/all-in-one:latest- UI:
http://localhost:16686 - Traces go to:
http://localhost:4318/v1/traces
Step 4: Simple Microservices that communicate
You’ll need two microservices:
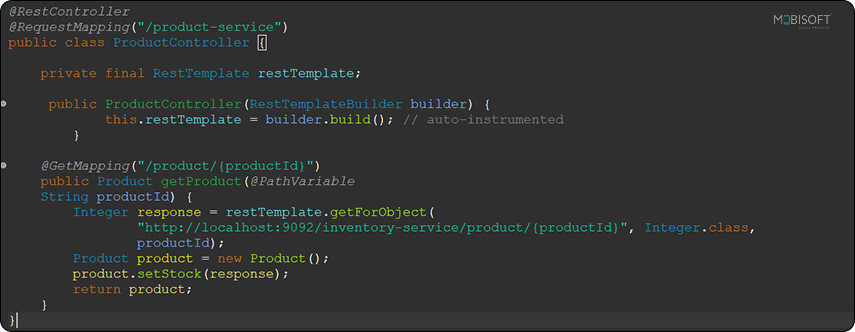
product-service(runs on port 9091)inventory-service(runs on port 9092)
product-service
inventory-service
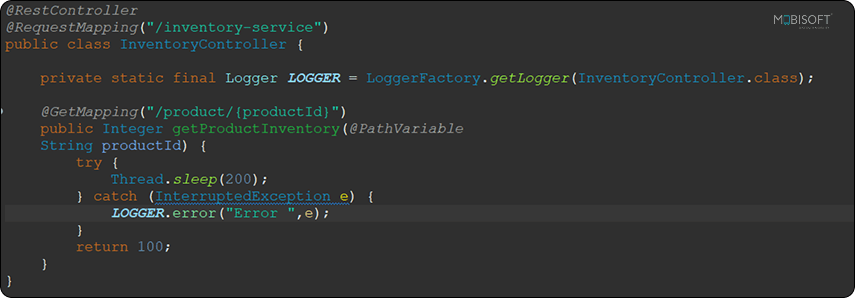
Make sure they can communicate over HTTP. This setup reflects typical Java microservices observability use cases. If you're also working with asynchronous message brokers, check out our spring boot kafka integration tutorial to complement your tracing setup with event driven communication.
Step 5: Fire a Request, Watch the Trace
Call your product service:
curl http://localhost:9091/product-service/product/101Now open Jaeger at http://localhost:16686 and select product-service. You’ll see the full request path from product → inventory, complete with timing details, headers, and propagation context demonstrating OpenTelemetry integration across services.

If you’re interested in boosting search features for your services, explore implementing opensearch with spring boot to integrate advanced search capabilities alongside observability.
Conclusion
With just:
- Three Maven dependencies
- Minimal configuration in
application.properties
You now have end-to-end distributed tracing in Spring Boot 3+ microservices with OpenTelemetry and Jaeger.
This gives you:
- End-to-end visibility
- Faster root cause analysis
- Performance monitoring
You can download the above example source code from our GitHub repository




 June 6, 2025


